
Calfoot
Team:
Abhinav Singh (Me)
Solo Project
Duration:
2 Months
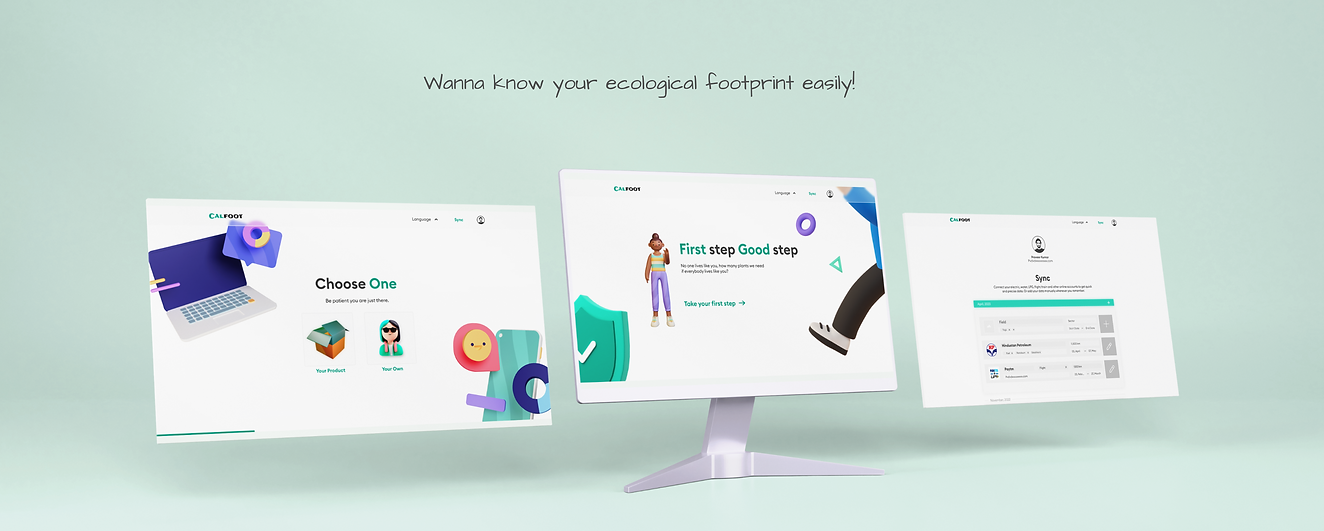
Wanna know your ecological footprint!
Isn’t it difficult? And how should I collect my data, its way more complicated then one can think?
Introducing CALFOOT seamless process, easy and efficient way to know your carbon footprint. Sync your accounts or add your data to get your information quickly and easily.
My Role:
UI/UX, Survey, UX Reacher, Product and Visual Designer

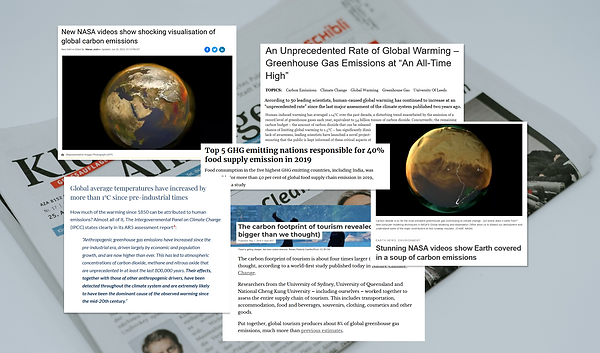
Desk Research
The deep dive by research about emissions of greenhouse gases and their impact on our lives and the planet. I also looked how nations have acknowledged this dilemma and have come together to reduce carbon footprints and address climate change through various international agreements and initiatives.
Present State of Affairs
It is difficult to answer minimum tolerance of world’s carbon footprint. It depends on several factors such as population, economic activity & lifestyle (choices of people in different regions).
Scope 1
Emissions are direct emissions from sources that are owned or controlled by the organization, such as emissions from combustion of fossil fuels for heat or electricity.
Scope 2
Emissions are indirect emissions from the generation of purchased electricity, heat, or steam consumed by the organization.
Scope 3
Emissions are all other indirect emissions that occur in the value chain of the organization, such as emissions from transportation, waste disposal, and production of purchased goods and services.
“Ideal” carbon footprint (or a “low” footprint) is anywhere from 6,000 to 15,999 pounds per year. 16,000-22,000 is considered average. Under 6,000 is considered very low. Over 22,000 requires urgent attention.
Technology
Technology is playing an increasingly important role in carbon footprint tracking by providing more accurate and efficient ways to measure and monitor emissions.
-
Remote sensing technologies, like satellite imagery and aerial photography, provide accurate and comprehensive data on emissions from large areas.
-
IoT devices enable real-time monitoring of energy consumption and transportation emissions.
-
Carbon footprint calculators use algorithms to estimate individual and organizational emissions.
-
Big data analytics identify patterns and trends in emissions for more effective reduction strategies.
-
Blockchain technology ensures transparency and accountability in carbon trading markets.
Market Analysis
Techniques & Technologies
-
Carbon capture and storage (CCS): CCS technologies can capture carbon dioxide emissions from power plants and industrial processes and store them underground, reducing their release into the atmosphere.
-
Circular economy: Adopting a circular economy model, which emphasizes recycling and reuse of materials, can help reduce the carbon emissions associated with the production of new products.
-
Sustainable agriculture: Promoting sustainable agriculture practices, such as regenerative agriculture and reducing food waste, can help reduce emissions associated with food production and distribution.
-
Carbon offsetting: Carbon offsetting involves investing in projects that reduce or offset carbon emissions, such as reforestation or renewable energy projects, to balance out the emissions generated by an individual or organization.
Competitive Audit
Competitive audit assisted me in determining where the current product and design stand in the market, as well as understanding the strengths and weakness of the competition. Finding gaps in the market would allow for the introduction of new and useful features to the user, leading to a more intuitive and enhanced user experience.

Research Insight
-
Difficult in finding a proper carbon footprint calculator.
-
Avoid to answer all questions, too big questionnaire.
-
Lack of track one’s routine, all answers are imprecise.
-
Most of the user’s information are assumption based.
-
Boring & clustered website escalates cognitive stress.
-
Result & conclusion are totally vague.
To derive deep into the issue and understand it from user’s perspective, I interviewed 5 people. The aim was to know more about their personal experience on Carbon footprint calculator.

User Survey
To understand user’s need and meet their goal, I conducted an online survey which was filled by 18 people.


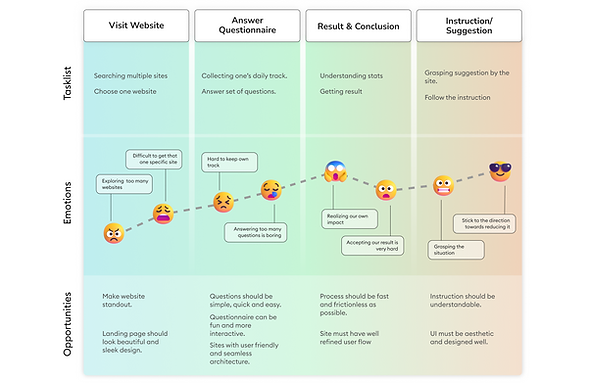
User Journey
A user journey map visually illustrates the user flow through the site, starting with initial contact or discovery, and continuing through the process of engagement into long-term loyalty and advocacy.
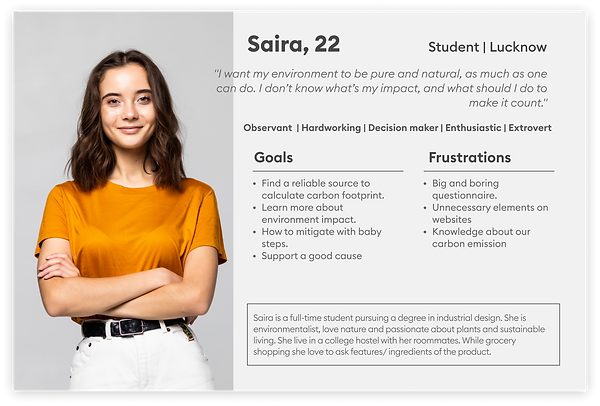
User Personas
A user journey map visually illustrates the user flow through the site, starting with initial contact or discovery, and continuing through the process of engagement into long-term loyalty and advocacy.

MoSCoW Analysis
Prioritization technique to get necessary requirements and features.

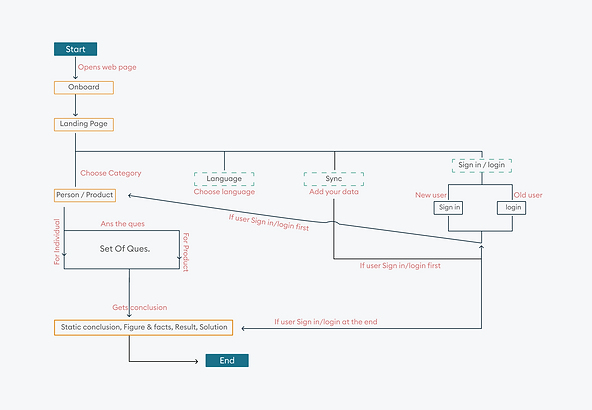
User flow
I analyzed how the user navigate through the current scenario and what decisions can they possibly make, and complete a task experience at a holistic level.
Card Sorting
Card sorting technique help me to determine the way information is grouped, labelled and organised within a site by allowing user to sort content topics into categories that make sense to them.


Information Architecture
Controlling the cognitive walkthrough.

Low Fidelity Wireframes
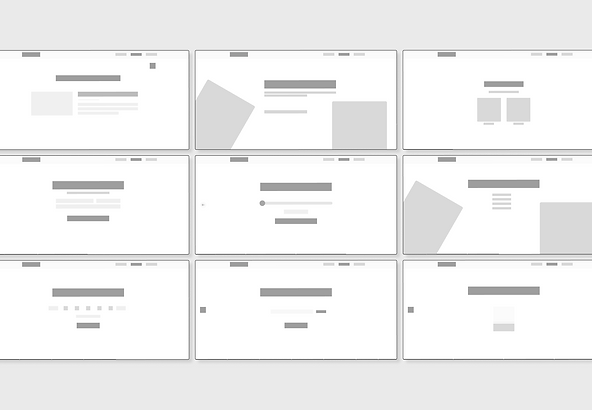
High Fidelity Wireframes
 |  |
|---|---|
 |  |
 |  |
 |  |
 |
Design
Colours & Typography
A gossamer green was chosen as a primary colour, with green having direct relation to healthy environment, while also evokes a feeling of abundance and is associated with refreshment and peace, rest and security and combined with the shades of grey and black.

Components & Buttons
Buttons follow a clear visual design and colours to give them a sense of hierarchy and while maintaining harmony among the different sets of button.

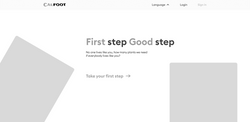
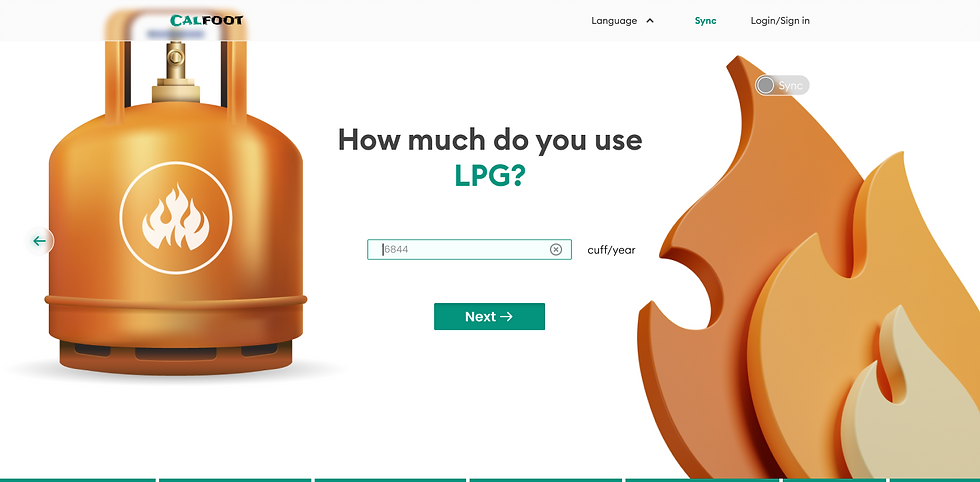
Home Page


Sync
Sync feature is provided to make user data entry more precise. Here user can add their electric, water, LPG, flight/train and other online accounts to get quick and precise data. Or add thier data manually whenever you remember.
Category
To simplify the user's decision making I'd given two choice to move further without creating panic situation. With less cognitive stress.
Sync option is given to tell about our special feature.


Sign in/Login
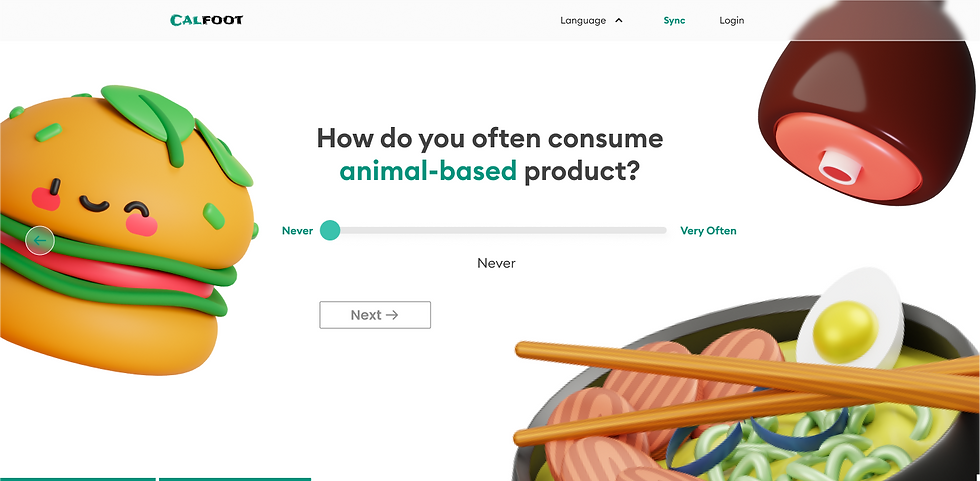
Product Questionnaire


Personal Questionnaire


Thank You
Thank you for watching